Abstract
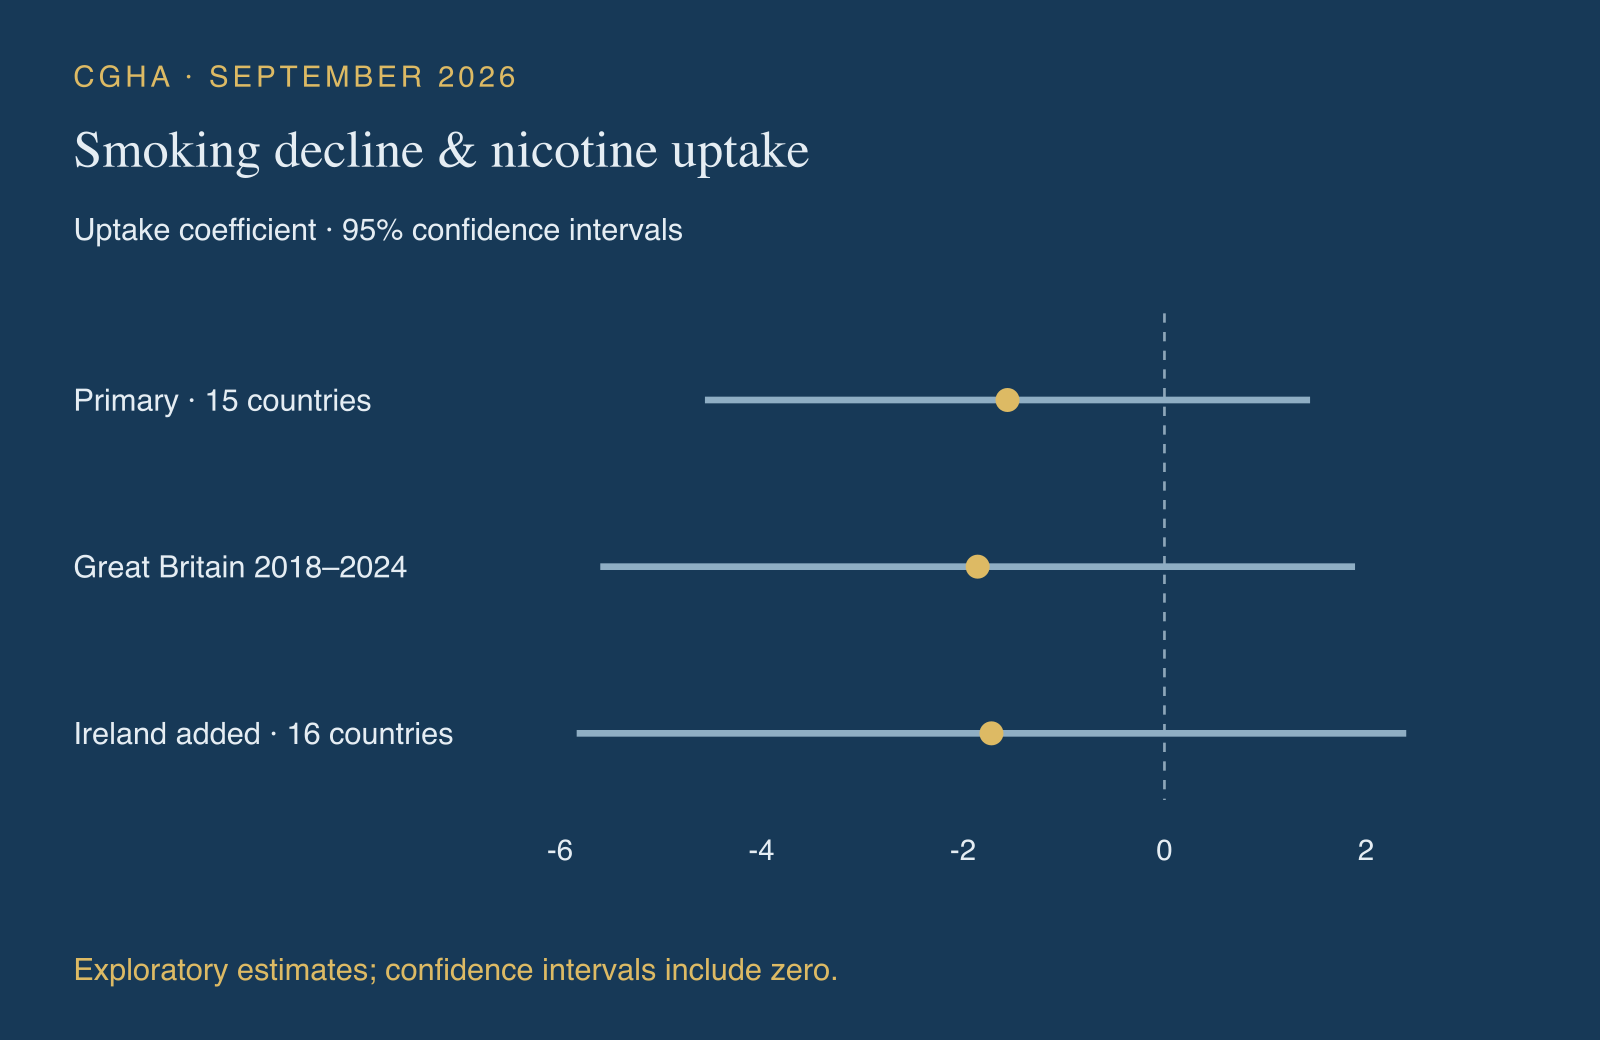
This paper tests whether faster growth in the current use of lower risk nicotine products is associated with faster decline in adult smoking. The prespecified primary model uses one nationally representative survey interval from each of 15 countries and adjusts for baseline smoking, cigarette affordability, conventional tobacco control policy and government effectiveness. The estimated uptake coefficient is −1.56 (standard error 1.30; 95 percent confidence interval −4.56 to 1.45; p=0.266). Its sign remains negative in every leave one country out model, with estimates from −2.47 to −0.86. A separate timing analysis of 70 nonoverlapping intervals in 14 countries also points in the expected direction: earlier uptake growth predicts a later smoking decline (coefficient −0.014; clustered standard error 0.008; p=0.083), while the contemporaneous and reverse direction tests are null. The stable direction, temporal ordering and absence of a reverse signal provide preliminary evidence that substitution may contribute causally to smoking decline. The sample remains too small to estimate the magnitude precisely, and the current Atlas classifications are used as a policy companion rather than a retrospective treatment measure.
Main finding
Across the primary model, timing tests and sensitivity analyses, faster lower risk nicotine uptake is associated with faster smoking decline. The coefficient remains negative under every country exclusion, uptake precedes the later decline, and prior smoking change does not predict later uptake. Taken together, this is preliminary evidence consistent with a causal substitution effect. The analysis is strongest on direction and causal plausibility; the exact effect size remains uncertain.
Key results
Primary model: uptake coefficient −1.56, standard error 1.30 and p=0.266, with 15 countries and 8 residual degrees of freedom.
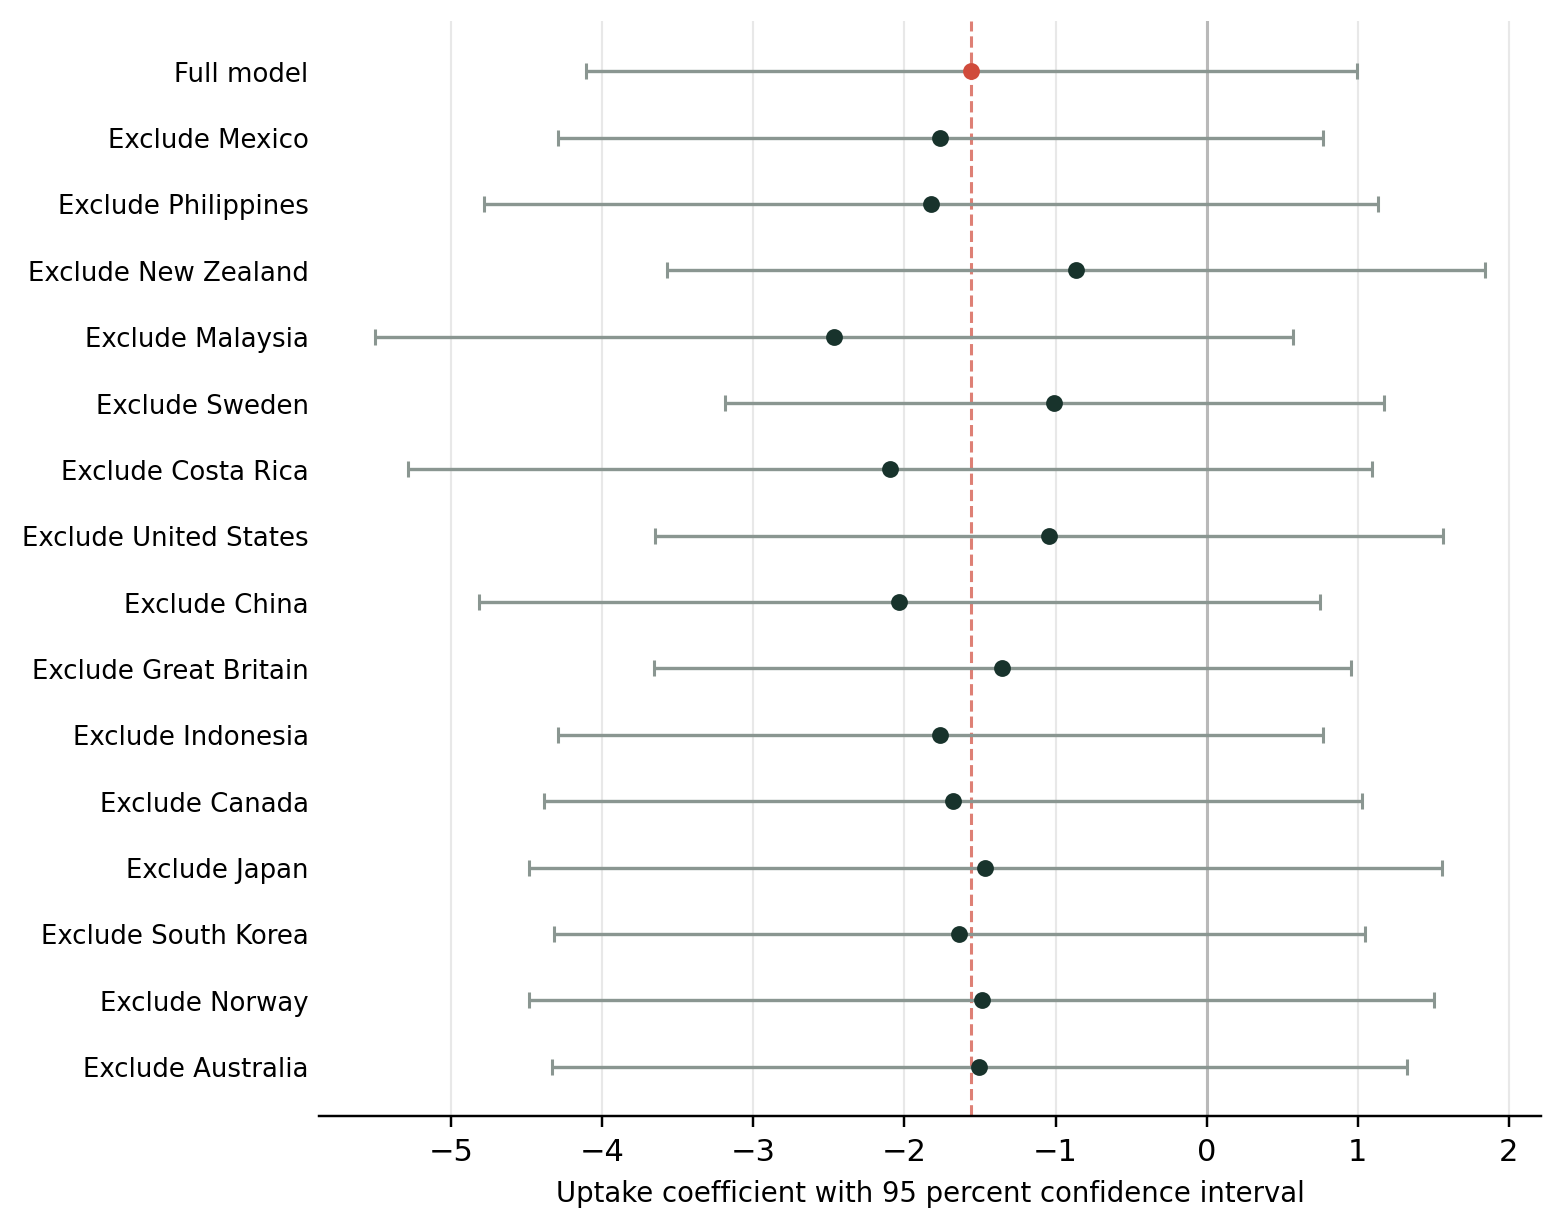
Leave one country out analysis: all 15 coefficients are negative, ranging from −2.47 to −0.86, showing that the direction does not depend on one country.
Timing analysis: prior uptake growth predicts a later smoking decline at p=0.083, while the contemporaneous and reverse direction tests are null.
Sensitivity models: a later Great Britain interval gives −1.85 (p=0.287), and adding Ireland gives −1.72 (p=0.370).
Research question
Many countries have reduced smoking while allowing adults access to vaping products, heated tobacco products, snus or nicotine pouches. That pattern is compatible with substitution, but it is also compatible with conventional tobacco control, changing prices, income growth, cohort replacement and other unmeasured factors. The empirical question is whether countries with faster measured uptake of lower risk nicotine products also experienced faster declines in adult current smoking after observable policy and institutional differences are considered.
The analysis was designed to avoid a common error in international policy comparisons: using a current policy classification to explain earlier changes in smoking. The CGHA Tobacco Control Alignment Atlas is a contemporary description of policy orientation. It cannot by itself identify the causes of smoking trends since 2000. The primary analysis therefore uses dated survey intervals and covariates tied to the same periods.
Study design
Prespecified eligibility
An eligible country interval required at least two nationally representative adult surveys with a matched age range, a matched definition of current product use and reported survey years. The smoking outcome had to measure current smoking rather than a broader tobacco category that could include the lower risk product in the exposure. Product launch dates and assumed market emergence were excluded from the primary exposure.
The primary sample contains 15 independent country intervals: Australia, Canada, China, Costa Rica, Great Britain, Indonesia, Japan, Malaysia, Mexico, New Zealand, Norway, the Philippines, South Korea, Sweden and the United States. Each country receives equal weight. Ireland is retained as a sensitivity case because its 2022 to 2023 interval is unusually short and produces a large annualized uptake change.
Variables
| Measure | Definition |
|---|---|
| Smoking outcome | Annual percentage point change in adult current smoking. |
| Substitution exposure | Annual percentage point change in current vaping, heated tobacco, snus or nicotine pouch use. |
| Baseline smoking | Adult current smoking prevalence at the start of the country interval. |
| Affordability | Annual change in the cigarette affordability measure over the matched policy interval. |
| Conventional policy | Annual change in a score covering advertising restrictions, smoke free rules and package warnings. |
| Institutional capacity | World Bank government effectiveness, fixed at or before the interval start. |
Statistical specification
The primary model is an equal weight ordinary least squares regression of annual smoking change on annual lower risk product uptake, baseline smoking, affordability change, conventional policy change, government effectiveness and an interaction between uptake and government effectiveness. The model fits seven parameters to 15 observations, leaving eight residual degrees of freedom. Conventional homoskedastic standard errors are reported because the country intervals are independent. The estimates are presented as preliminary, with confidence intervals and influence tests showing the remaining uncertainty.
The coefficient on uptake represents the estimated change in annual smoking decline associated with a one percentage point faster annual increase in current lower risk product use when government effectiveness is zero on the World Bank scale. Because the interaction term is included, the implied uptake slope varies with government effectiveness. The coefficient is evidence about the direction and plausibility of a substitution effect; the small sample limits precision about its population magnitude.
Primary results
The estimated uptake coefficient is −1.56. Its negative sign is consistent with substitution; the standard error is 1.30 and the p value is 0.266. The interaction with government effectiveness is positive and uncertain, rather than the expected negative interaction. The primary estimate is therefore directionally informative but does not isolate a separate institutional-capacity effect.
Table 1 Primary 15 country model
| Term | Coefficient | Standard error | p value | 95 percent CI |
|---|---|---|---|---|
| Intercept | 0.181 | 0.343 | 0.612 | −0.610 to 0.972 |
| Uptake change | −1.558 | 1.302 | 0.266 | −4.560 to 1.444 |
| Baseline smoking | −0.0048 | 0.0120 | 0.701 | −0.032 to 0.023 |
| Affordability change | −0.552 | 0.396 | 0.201 | −1.465 to 0.361 |
| Conventional policy change | 1.511 | 0.860 | 0.117 | −0.472 to 3.494 |
| Government effectiveness | −0.256 | 0.210 | 0.258 | −0.740 to 0.228 |
| Uptake by government effectiveness | 0.686 | 0.783 | 0.406 | −1.120 to 2.492 |
Model diagnostics
The design matrix condition number is 474.83. Two observations exceed the prespecified leverage threshold and three have Cook’s distance above one, so individual countries can affect the estimated magnitude. South Korea itself has low leverage and low Cook’s distance, and the negative direction survives every country exclusion. The diagnostics support treating the sign as more stable than the exact coefficient.
Leave one country out results
The uptake coefficient remains negative in all 15 reduced models. Excluding New Zealand produces the weakest association at −0.86, while excluding Malaysia produces the strongest at −2.47. The requested checks also remain negative when Mexico, the Philippines or New Zealand is omitted. This directional stability strengthens the preliminary substitution finding, while the range describes current uncertainty about magnitude.
Timing and direction tests
A separate panel test asks whether uptake precedes smoking decline. It uses 70 nonoverlapping intervals from 14 countries and clusters standard errors by country. Earlier uptake growth predicts a subsequently faster smoking decline with a coefficient of −0.014 (95 percent confidence interval −0.030 to 0.002; p=0.083). The same observations show almost no contemporaneous association, and earlier smoking change does not significantly predict later uptake change. This temporal ordering and null reverse-direction result increase the plausibility that substitution contributes to later smoking decline, although unmeasured country-level changes remain possible.
Table 2 Timing and direction tests
| Test | Intervals | Countries | Coefficient | Clustered SE | p value |
|---|---|---|---|---|---|
| Prior uptake predicts later smoking change | 70 | 14 | −0.0141 | 0.0075 | 0.083 |
| Contemporaneous comparison | 70 | 14 | −0.0026 | 0.0181 | 0.888 |
| Prior smoking change predicts later uptake | 70 | 14 | 0.3179 | 0.4047 | 0.446 |
Sensitivity analyses
Table 3 Main sensitivity results
| Specification | Countries | Uptake coefficient | Standard error | p value | Interpretation |
|---|---|---|---|---|---|
| Primary model | 15 | −1.558 | 1.302 | 0.266 | Negative and imprecise |
| Great Britain 2018 to 2024 | 15 | −1.854 | 1.624 | 0.287 | Direction retained |
| Ireland added | 16 | −1.717 | 1.820 | 0.370 | Direction retained |
| Exclude Mexico | 14 | −1.762 | 1.290 | 0.214 | Stronger magnitude |
| Exclude Philippines | 14 | −1.824 | 1.510 | 0.267 | Direction retained |
| Exclude New Zealand | 14 | −0.865 | 1.382 | 0.551 | Weaker magnitude |
Great Britain endpoint
Replacing the 2014 to 2024 Great Britain interval with 2018 to 2024 changes annual vaping growth only slightly, from 0.63 to 0.62 percentage points, but changes annual smoking decline from −0.97 to −1.25 points. The uptake coefficient becomes −1.85 and retains the same direction. The preliminary substitution finding is therefore stable to the Great Britain endpoint choice.
Ireland extension
Ireland raises the sample to 16 countries. Current vaping increased from 6 percent to 8 percent between 2022 and 2023 while current smoking remained at 18 percent. The resulting annualized exposure is large, and Ireland has leverage of 0.51 and Cook’s distance of 0.74. The estimated uptake coefficient remains negative at −1.72. Because a one year interval is more vulnerable to survey noise and temporary change, the 15 country model remains the primary specification.
Interpretation
Faster uptake of lower risk nicotine products is associated with faster smoking decline in the primary model, the sign survives every country exclusion, and the separate timing analysis points in the same direction. The null reverse-direction test further distinguishes the observed pattern from a simple response of uptake to earlier smoking decline. Together these results provide preliminary evidence consistent with substitution contributing causally to falling smoking rates.
The current data are more informative about direction than magnitude. Confidence intervals are wide, the primary model has eight residual degrees of freedom, and coefficients vary when some countries are excluded. Product types also differ, so later updates should test vaping, heated tobacco and oral nicotine separately as the strict sample grows.
The interaction result does not show that government effectiveness makes the uptake relationship more negative. A separate exploratory panel analysis finds that current practical access scores interact with uptake in the expected direction. That result suggests that access may matter, but historical policy scores will be needed to test the institutional channel directly.
Limitations
Sample size and effect precision. Seven parameters are estimated from 15 country intervals. The consistent sign is informative, while confidence intervals and influence diagnostics show that the magnitude remains preliminary.
Observational design. Unmeasured changes in income, culture, enforcement, cessation treatment, product prices and industry behavior may contribute to the relationship. The timing and reverse-direction tests reduce, but do not eliminate, this concern.
Survey comparability. The analysis admits only matched within country definitions, but age ranges, survey modes and product questions still differ across countries.
Heterogeneous exposure. Vaping, heated tobacco, snus and nicotine pouches are grouped as lower risk products for the cross country test even though their markets and risk profiles differ.
Annualization. Dividing change by interval length aids comparison but can amplify noise in short intervals, most clearly in the Ireland sensitivity case.
Standard errors. The primary model uses conventional standard errors for independent country intervals. Additional countries will permit more reliable influence-robust inference.
No mortality inference. The coefficients concern changes in survey prevalence. They cannot be translated directly into deaths avoided without a separate exposure, disease lag and risk model.
Policy relevance
The results support treating lower risk nicotine substitution as a plausible contributor to national smoking decline. They favor policy frameworks that distinguish product access from product safety regulation and that measure smoking and lower risk product use consistently over time. Continued updates should preserve product-specific outcomes, record effective policy dates and publish comparable adult current-use series.
Conclusion
The assembled evidence provides a coherent preliminary case for nicotine substitution. The primary coefficient is negative, every leave one country out estimate is negative, earlier uptake growth predicts a later smoking decline, and the reverse-direction test is null. These results make a causal contribution plausible and justify continued analysis as new country intervals become available. The present study is most informative about direction; future updates can narrow the effect-size range through a larger strict sample, product-specific exposure measures and influence-robust inference.
Data sources
The analysis uses national survey series and policy covariates documented in the accompanying CGHA model workbook. The workbook records survey definitions, endpoint years, calculations and source links for each country. The principal cross national inputs and the recent extensions are listed below.
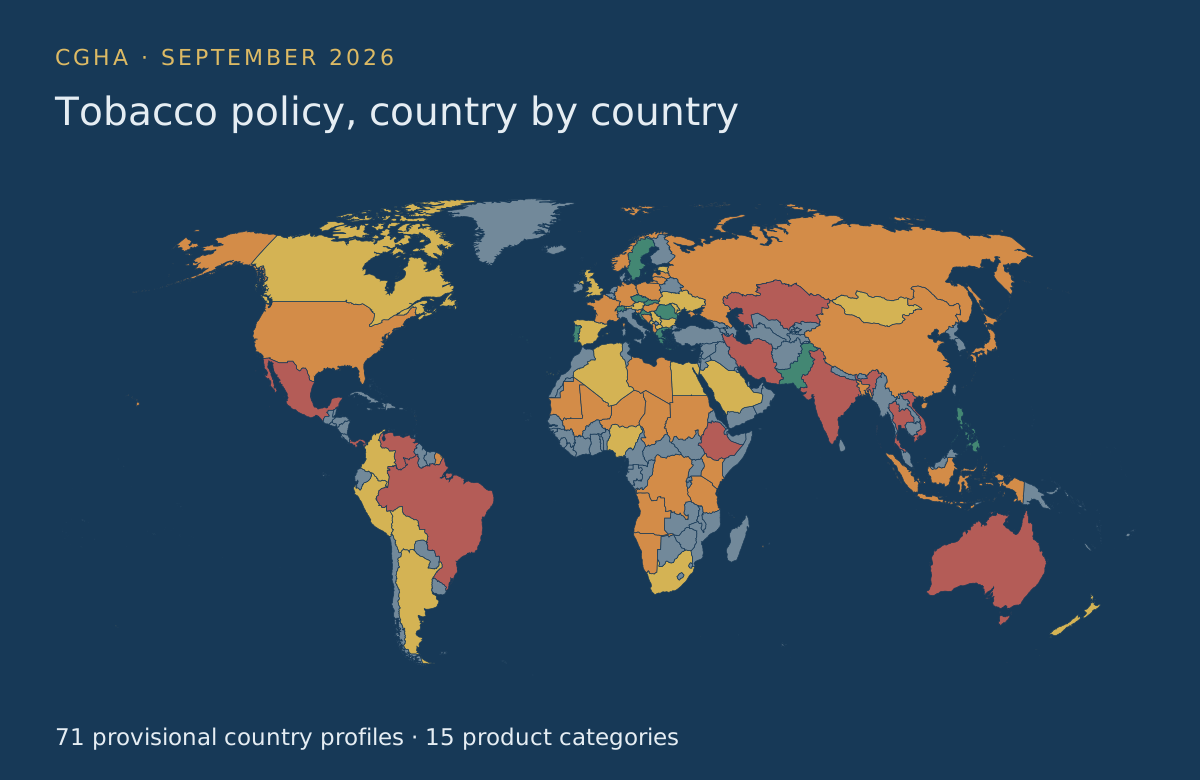
Interactive policy companion CGHA Tobacco Control Alignment Atlas. The Atlas presents the current policy classification and country profiles. It is a companion to this analysis, not the historical treatment variable or the source of the longitudinal estimates.
World Health Organization. WHO tobacco control and smoking prevalence datasets, including policy and affordability observations used for matched interval covariates.
World Bank. Worldwide Governance Indicators, government effectiveness estimate fixed at or before each country interval start.
Office for National Statistics. Opinions and Lifestyle Survey series on e cigarette use and adult smoking habits in Great Britain.
Korea Disease Control and Prevention Agency. 2025 Community Health Survey tobacco analysis, including current heated tobacco use and cigarette smoking for adults aged 19 years and older.
Department of Health Ireland. Healthy Ireland Survey 2023, including current vaping and current smoking for the population aged 15 years and older.
National statistical and health agencies. Country specific adult survey series for Australia, Canada, China, Costa Rica, Indonesia, Japan, Malaysia, Mexico, New Zealand, Norway, the Philippines, Sweden and the United States, as cited in the workbook source register.
Reproducibility note
All reported coefficients, standard errors, p values, influence measures and sensitivity results are stored in the workbook CGHA Atlas Longitudinal Smoking and Substitution Model September 2026. The locked 15 country model is the primary specification. The Great Britain endpoint test, Ireland extension and both leave one country out analyses are retained as separate worksheets so that the analytical sequence is auditable. The paper and workbook are living research products and will be updated as additional comparable country intervals become available.
Appendix country sample
| Primary sample | Sensitivity only |
|---|---|
| Australia Canada China Costa Rica | Ireland |
| Great Britain Indonesia Japan Malaysia | |
| Mexico New Zealand Norway Philippines | |
| South Korea Sweden United States |